Gene Set Enrichment Analysis (GSEA) tutorial
1. Download app

2. Prepare Data
a. Data matrix
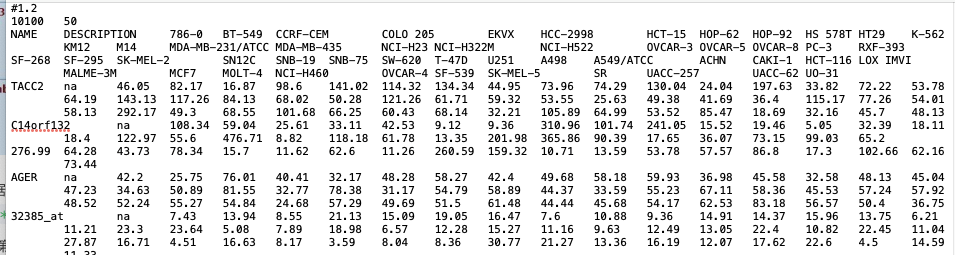
requirement: — .gct; tab seperated — 1st row: #1.1 or #number — 2nd row: two number: gene number and sample number — 1st column show the gene names — 2nd column show the description; fill NA if it is empty. — from 3rd column, list expression matrix in each column for each samples — the expression matrix should be normalized and log transformed.
 https://software.broadinstitute.org/cancer/software/gsea/wiki/index.php/Data_formats#Expression_Data_Formats
sample:
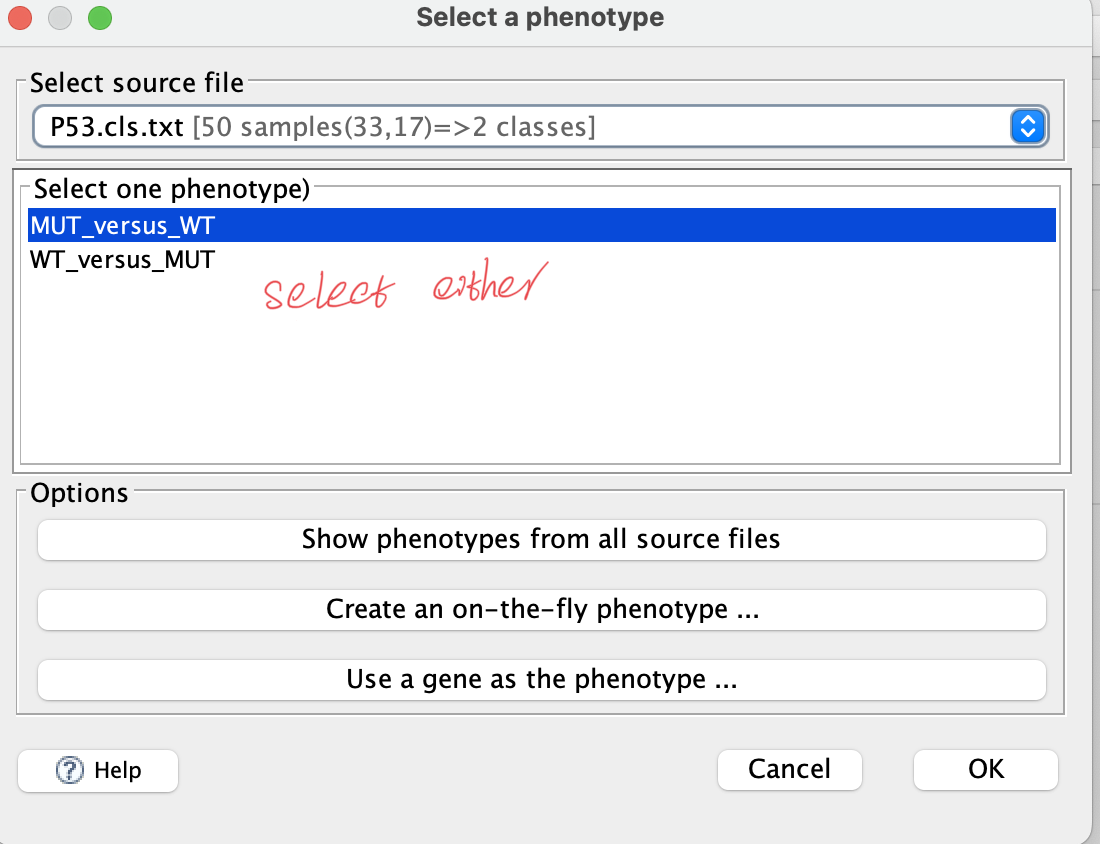
b. Phenotype labels
— .cls format; separate with tab — there are 3 numbers in 1st row: sample amount amount of groups 1 (fixed number) — 2nd row: initial with # and separate with tab — group name for each of samples, corresponding to the columns in data matrix
50 2 1 #MUT WT MUT MUT MUT MUT MUT MUT MUT MUT MUT MUT MUT MUT MUT MUT MUT MUT MUT MUT MUT MUT MUT MUT MUT MUT MUT MUT MUT MUT MUT MUT MUT MUT MUT WT WT WT WT WT WT WT WT WT WT WT WT WT WT WT WT WT
or

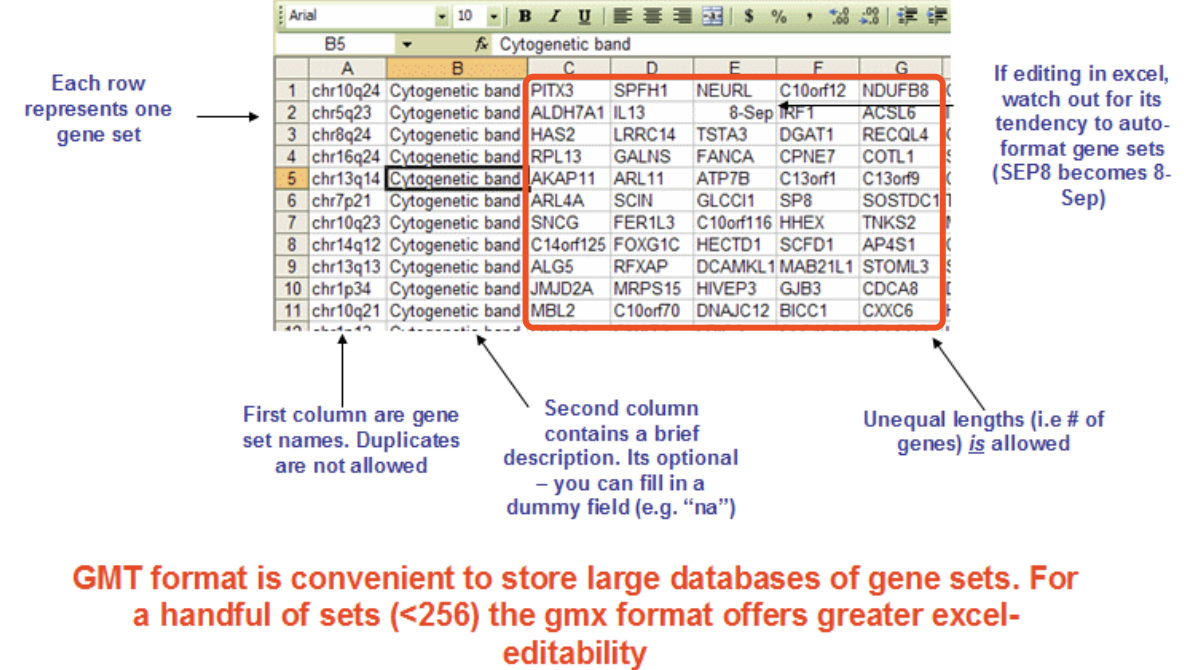
c. Gene set
the file is .gmt format
usually use the Molecular Signatures Database (MSigDB) offered from the
or customized gene set with
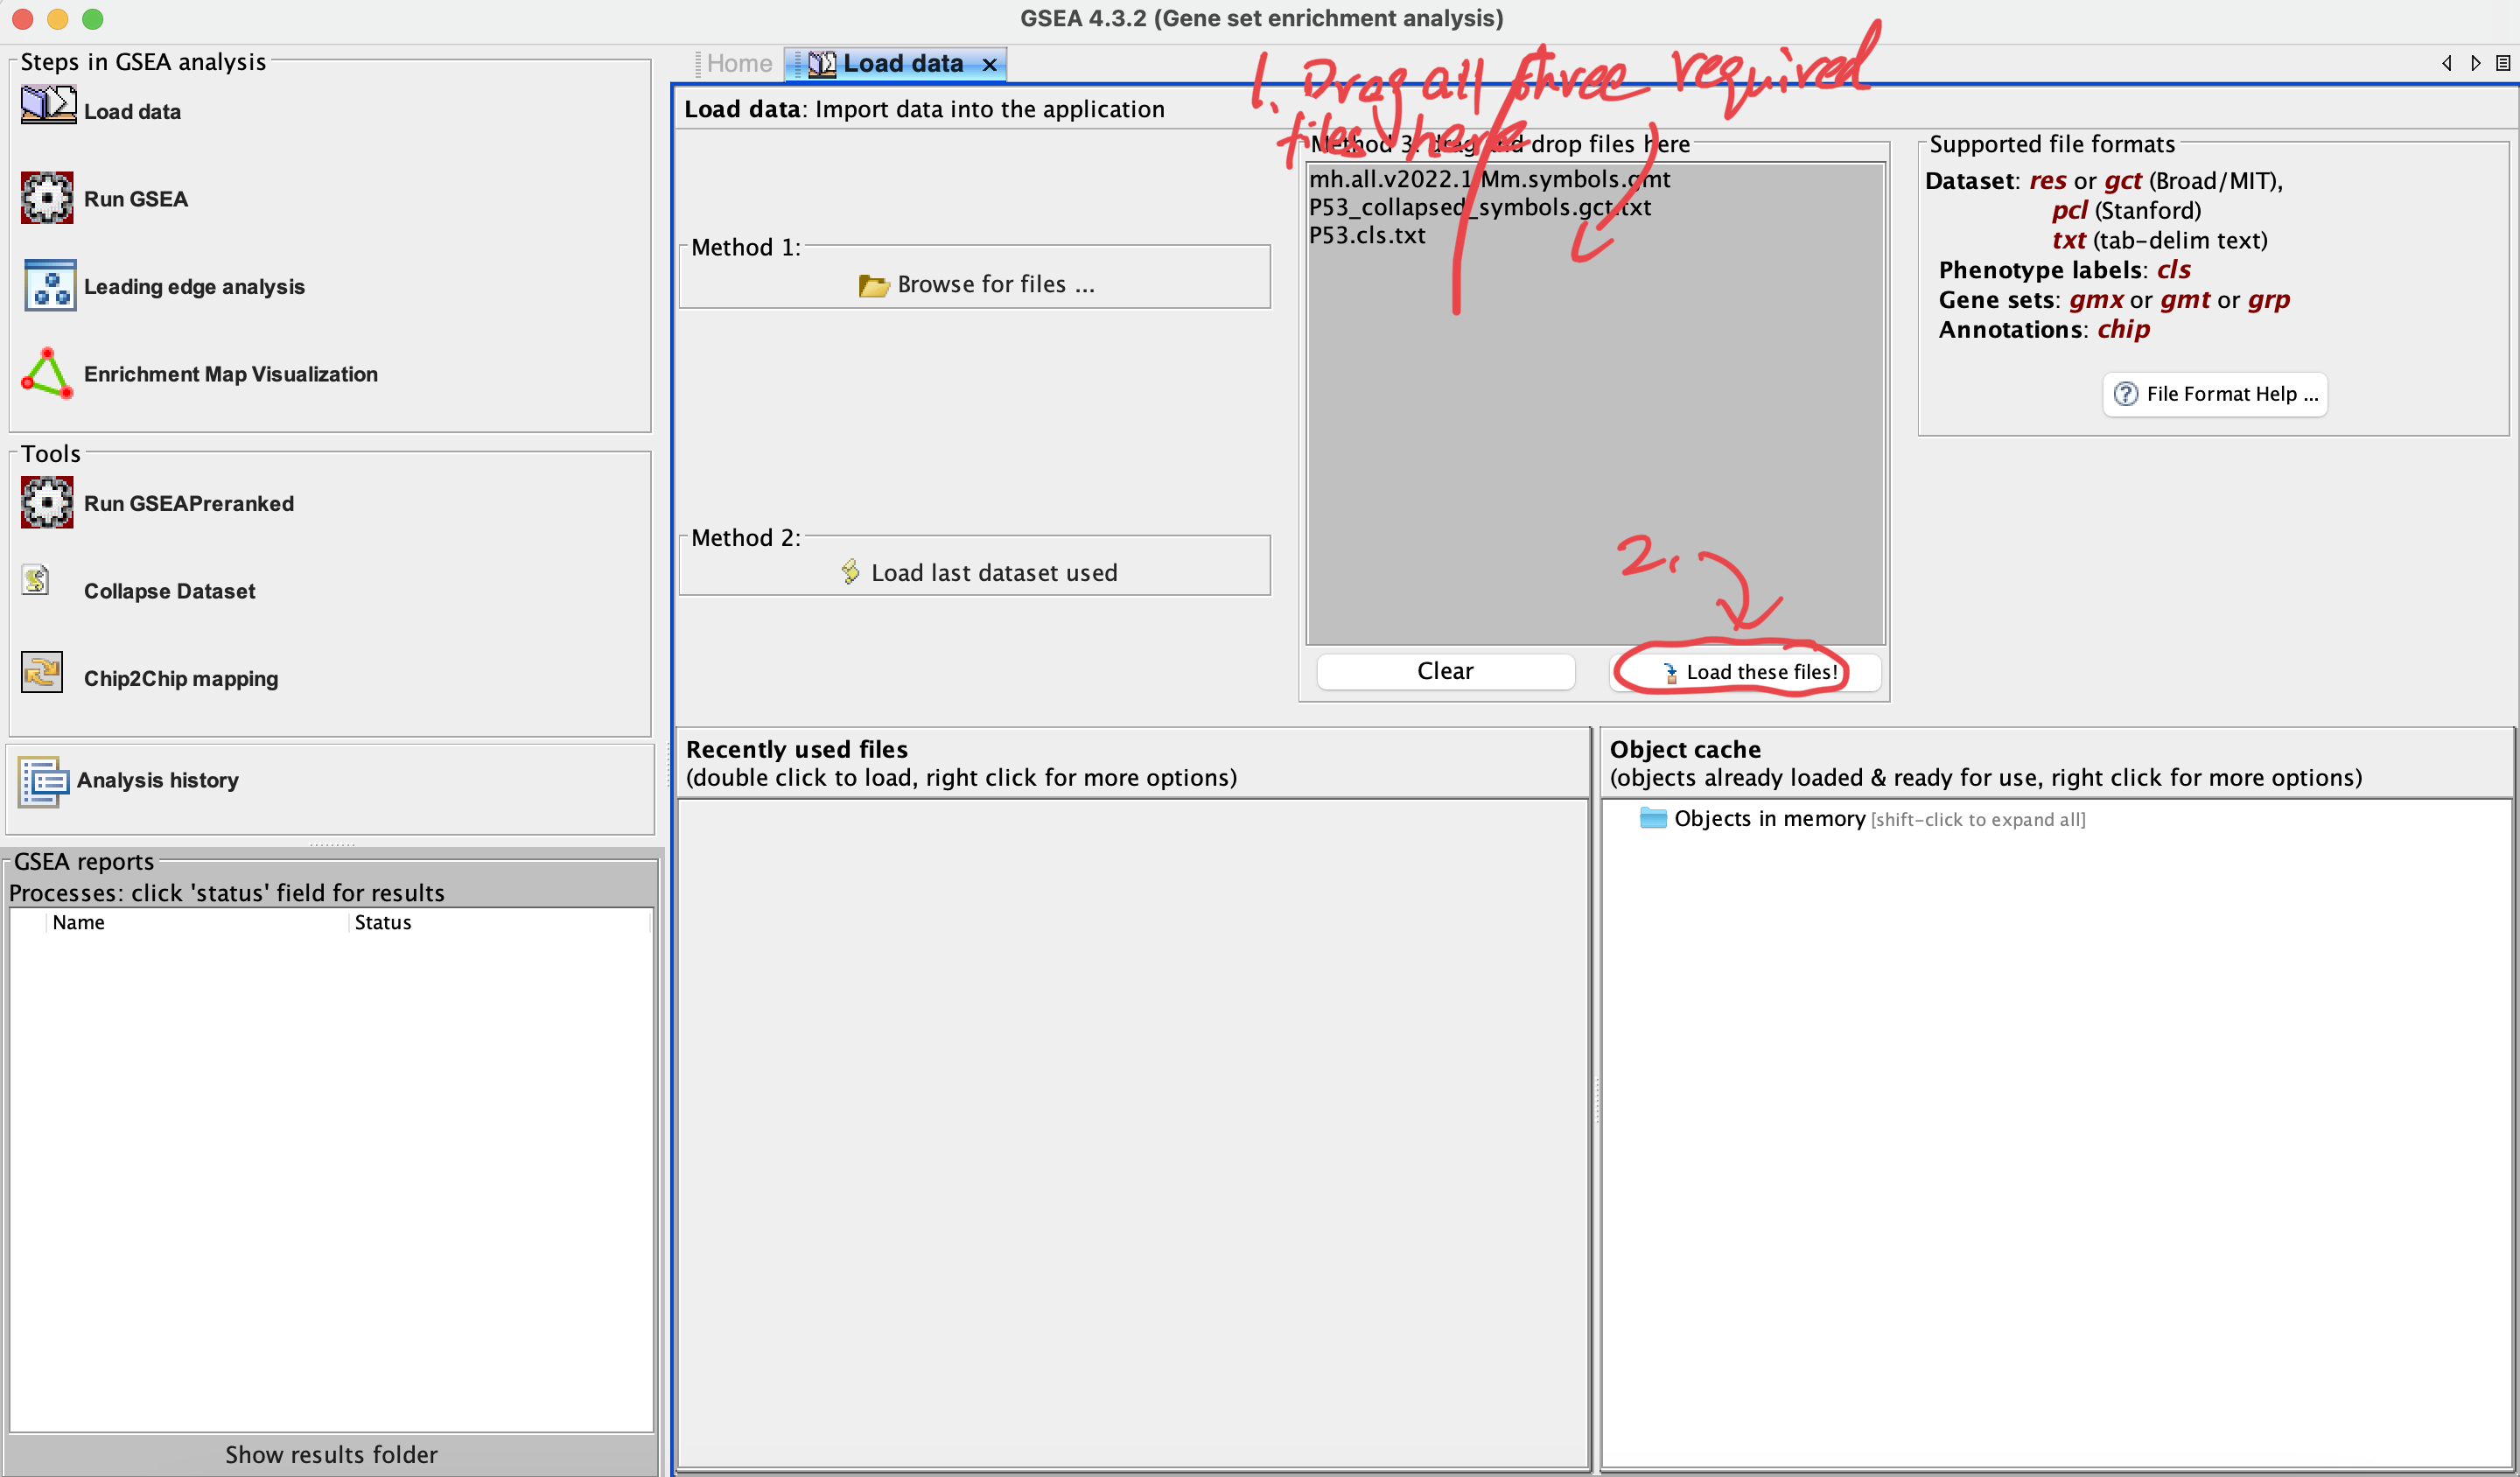
3. Load data
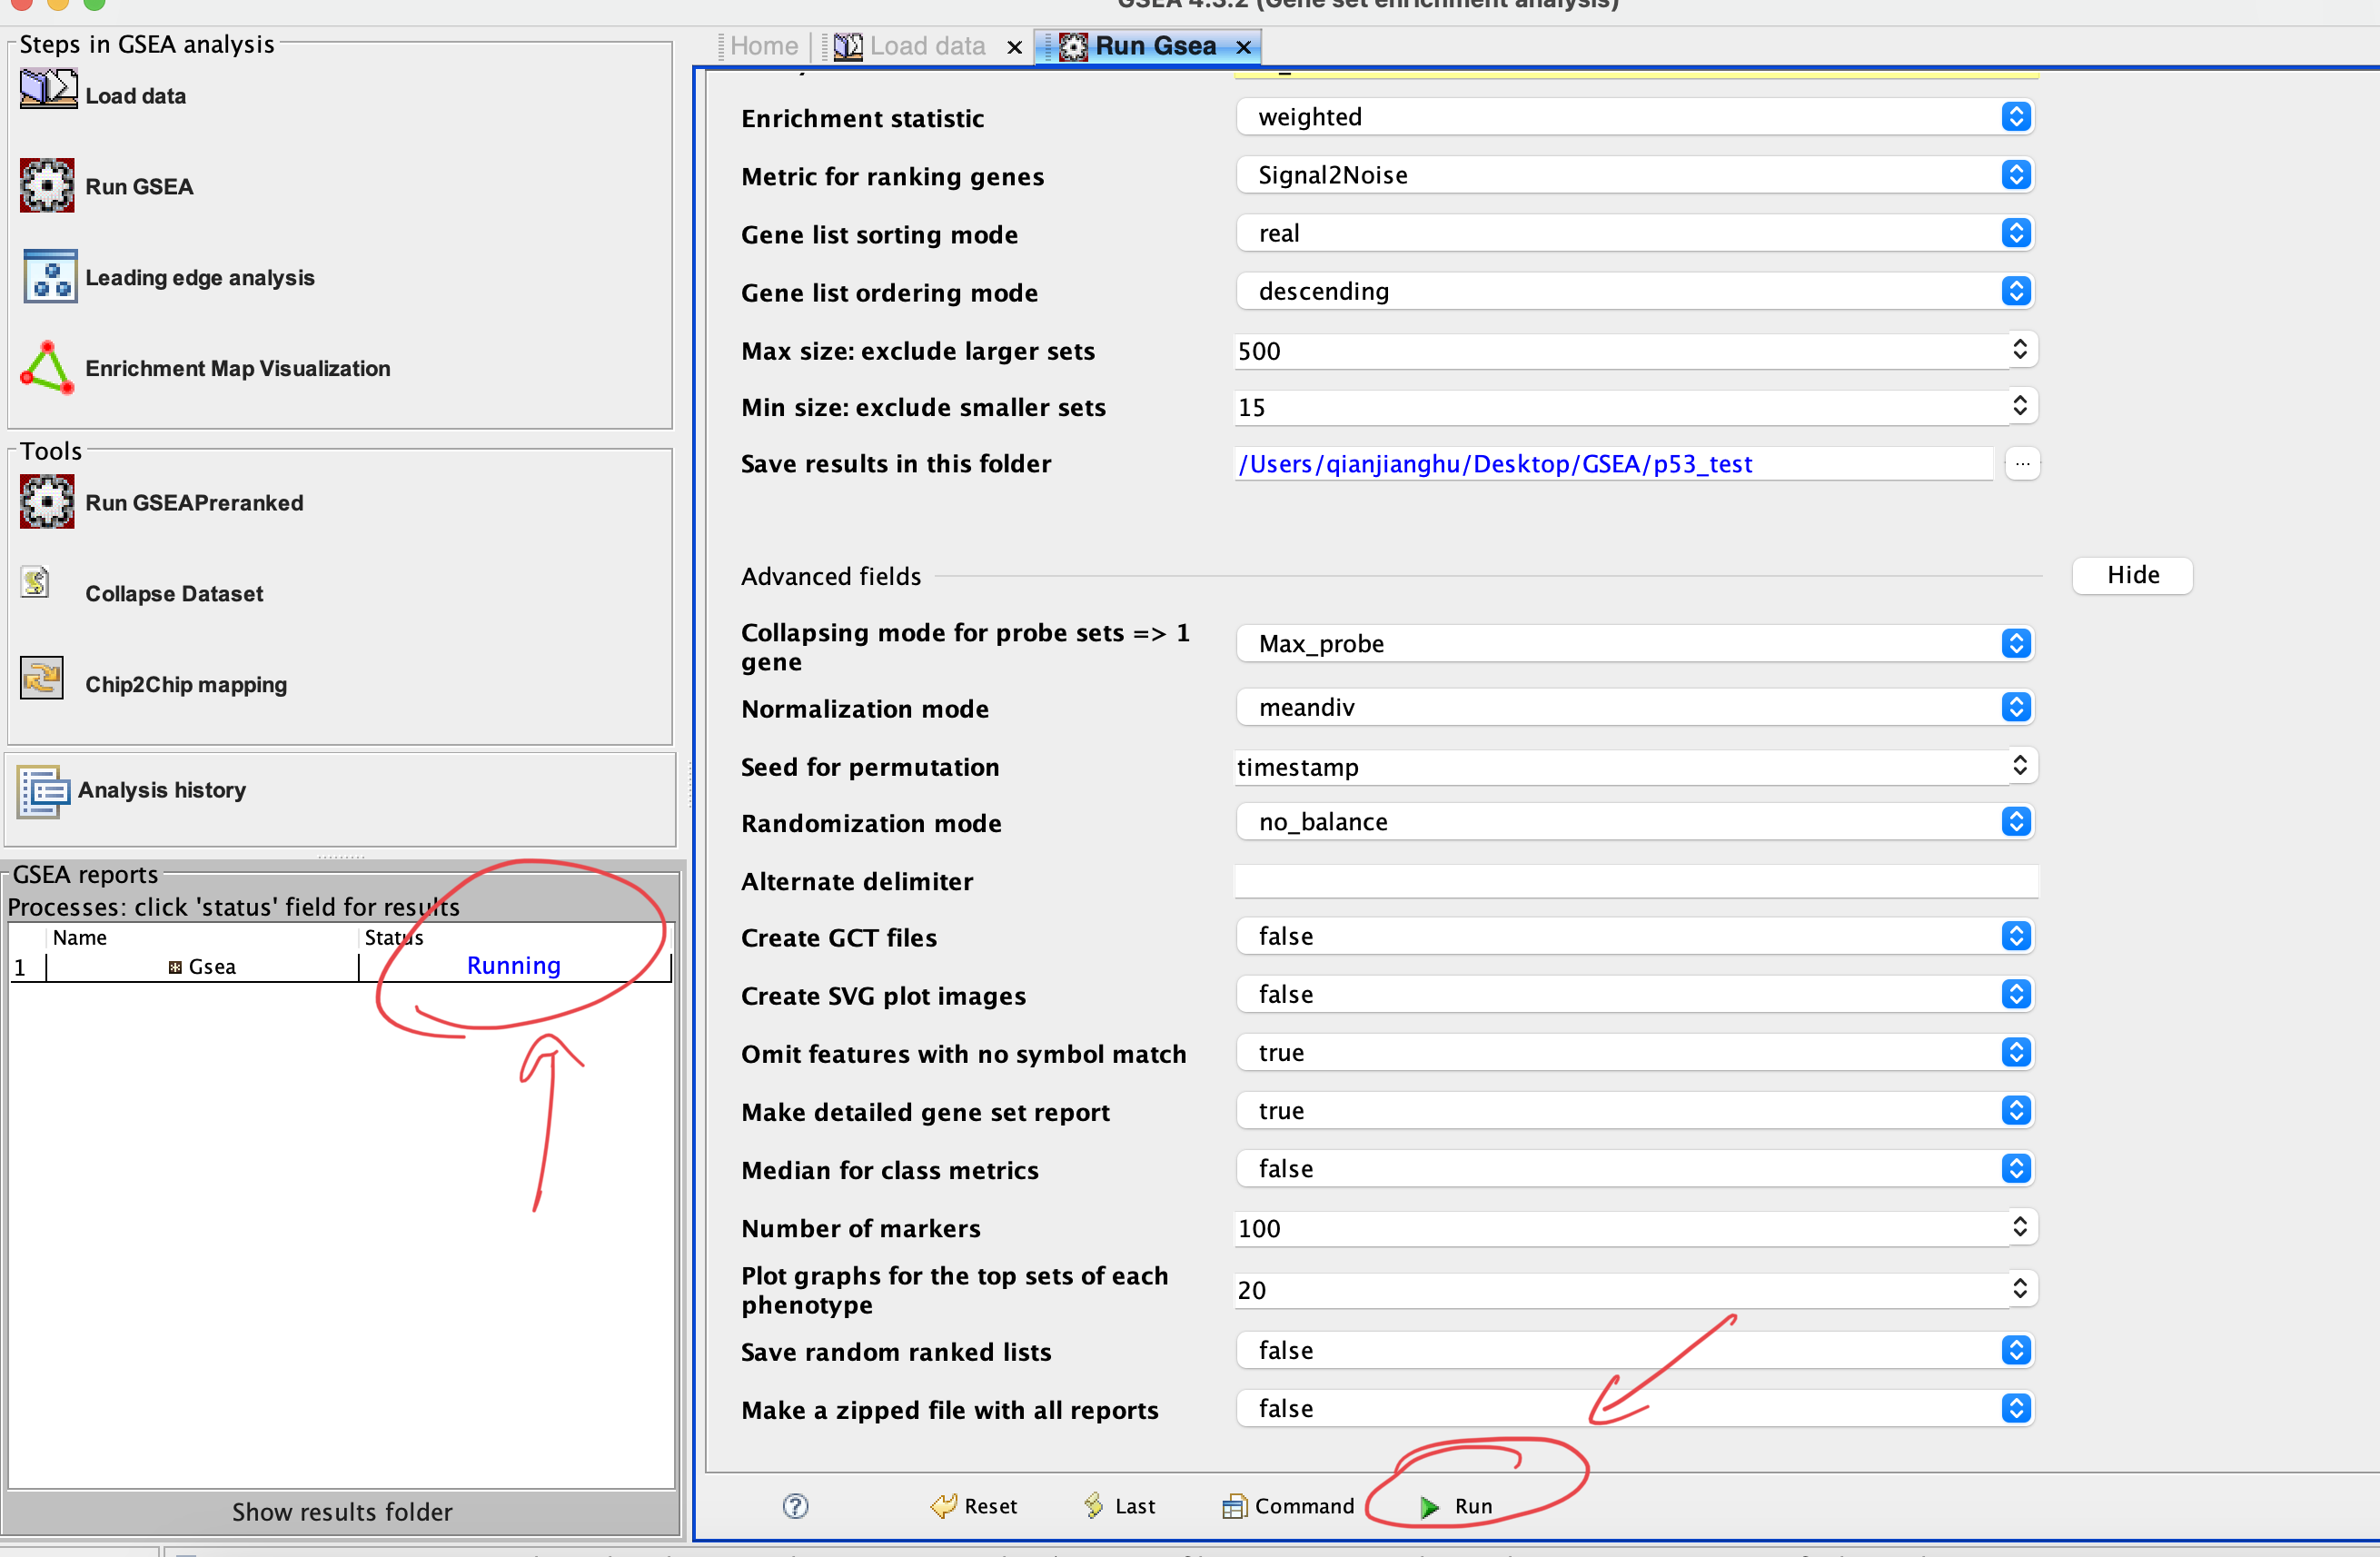
Number of permutations:default 1000; the larger, the more precise but consume more RAM
Collapse dataset to gene symbols:choose ‘No’ if the both of expression matrix and gene set are using the gene symbol
Permutation type:choose phenotype if sample number of each group > 7, othewise choose gene set
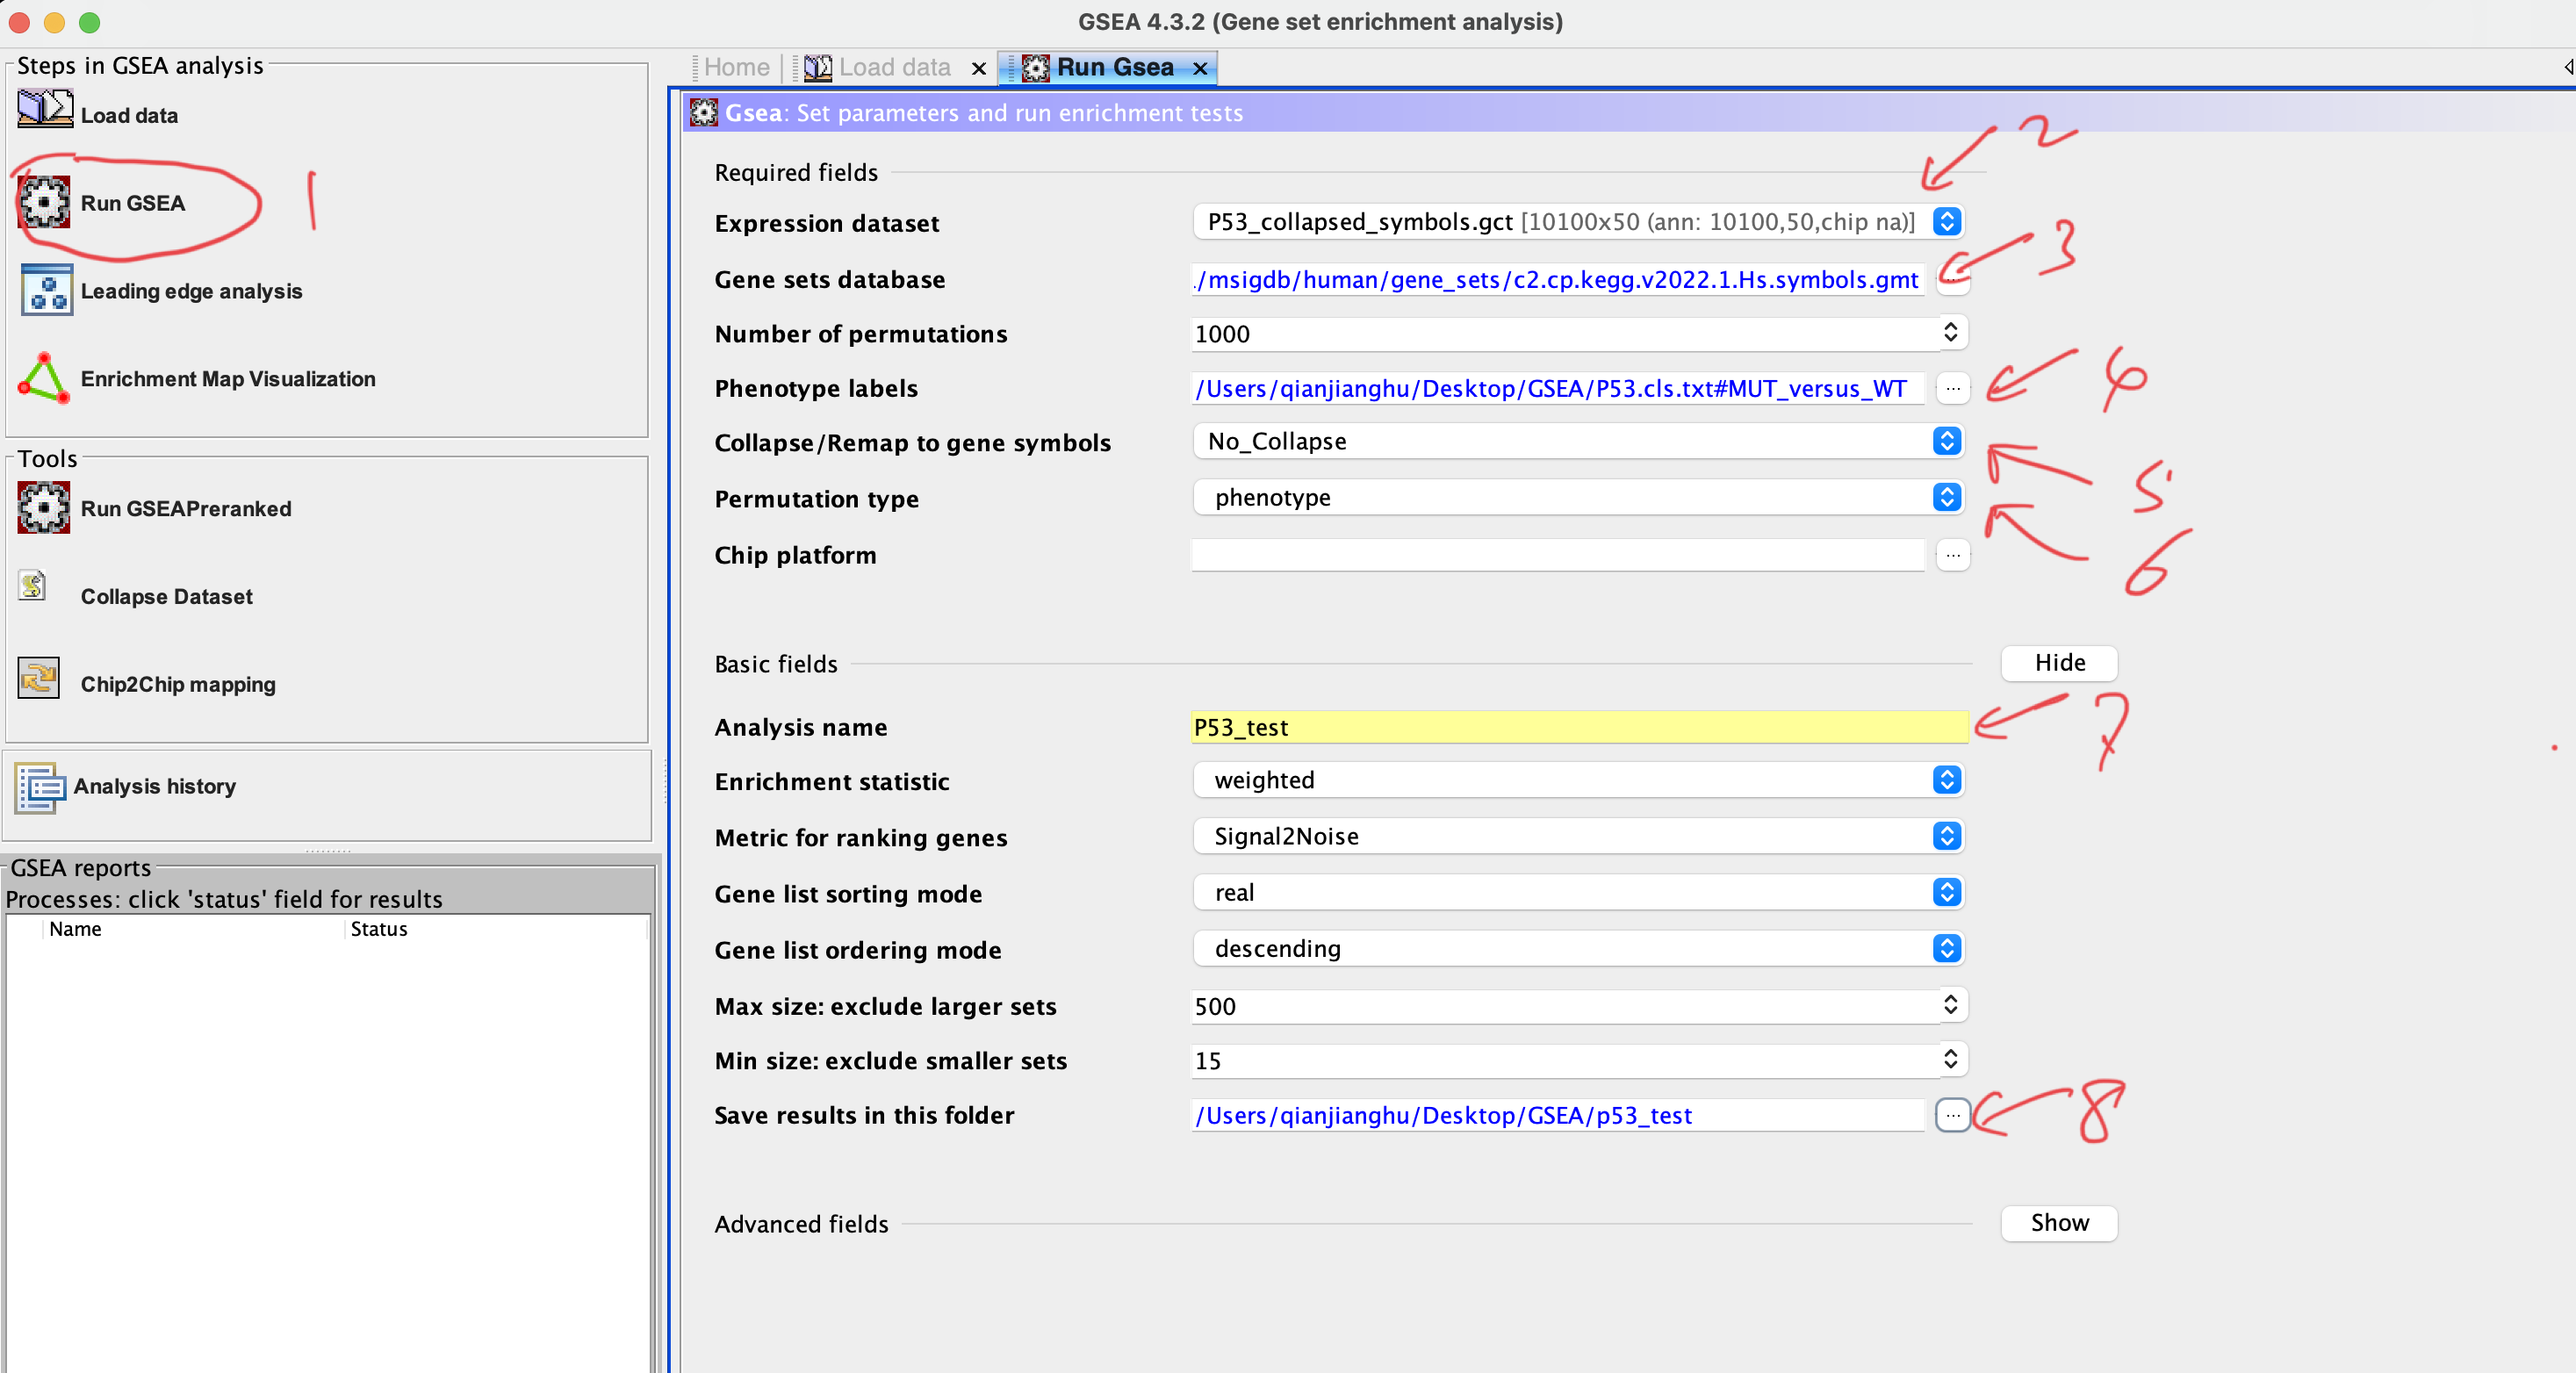
Plot graphs for the top sets of each phenotype: numbers of plots showed in resultes; usually use larger number if you have a large gene set
RUN